September 2016
September 22, 2016
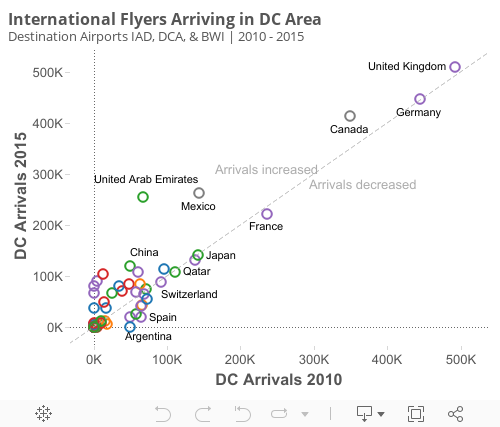
Now Landing in Washington, DC
Air travelers come to DC for a variety of reasons – on business, on vacation, on a stopover en route elsewhere, and of course returning DMV residents end their round trip journeys here. We used US Department of Transportation data on domestic and international flights to satisfy our curiosity about where DC visitors (and residents) are traveling from. The Air Carrier Statistics dataset shows where passengers originated, with or without stopovers, as long as they remained on the same flight number. All of the passengers counted here deplaned in one of the DC area’s three major airports, Dulles (IAD), Reagan National (DCA), and Baltimore Washington International (BWI).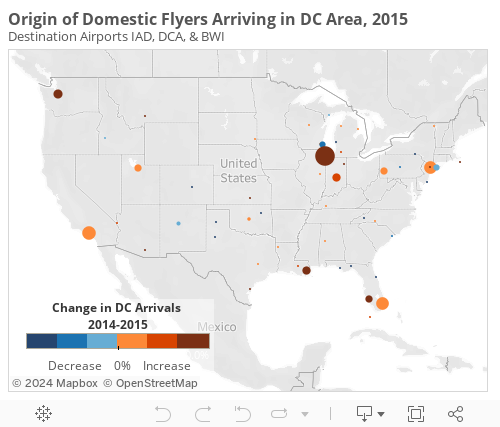
September 9, 2016
The Evolution of DC’s Creative Economy
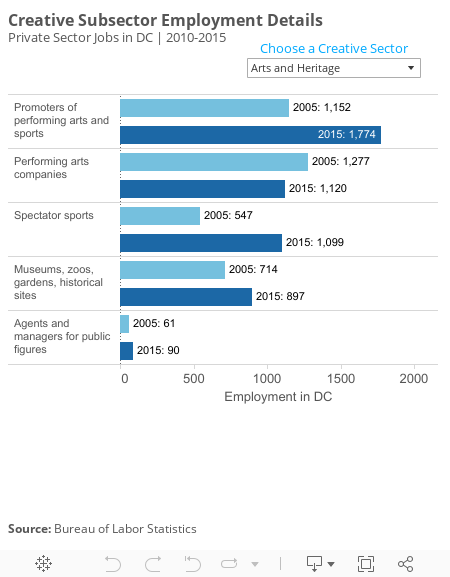
September is Creative Economy month in DC, a time to celebrate and support the creators working in DC. Check out the #202Creates initiative for some examples of what’s going on in the District this month. A few weeks ago, we explored the “Creative Class” in DC – a separate and more academic concept than the “Creative Economy”. While the Creative Class includes occupations which require creative problem-solving skills, like attorneys, we set out to define the Creative Economy a bit more narrowly. When we talk about the Creative Economy in DC, we mean professions centered around artistic and production-related efforts. In 2014, DMPED put together a study on the Creative Economy which defined four creative sectors – Arts and Heritage, Culinary, Information Services, and Professional Services. In this week’s analysis, we return to those sectors to take a look at how DC’s Creative Economy has evolved in the past 10 years. To the original four sectors, we’ve also added a new one, the Fashion and Retail sector, to encompass makers, service providers, and retailers in fashion and personal care. Using BLS Quarterly Census of Employment and Wages (QCEW) data, we looked at jobs in these specific Creative Economy sectors in 2005 and 2015.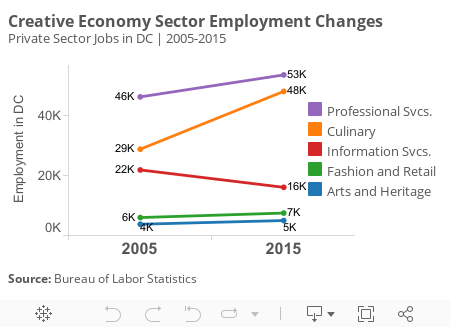
DC lost creative jobs in the information services sector in these 10 years, largely due to declines in a few key areas. News media employment categories like newspaper/periodical publishing and telecommunications have seen major employment declines, which mirrors a larger structural trend seen throughout the country. Data processing also declined, an employment category which may have simply become less people-intensive in the last decade. On the other hand, internet publishing was not even a category in 2005, but accounted for over 1000 jobs in DC in 2015. However, DC has gained jobs in radio broadcasting and in the news syndicates category. And today, the Mayor and Deputy Mayor are focused on creating new ways to support the growth of new media and broadcast employment in the District.
September 2, 2016
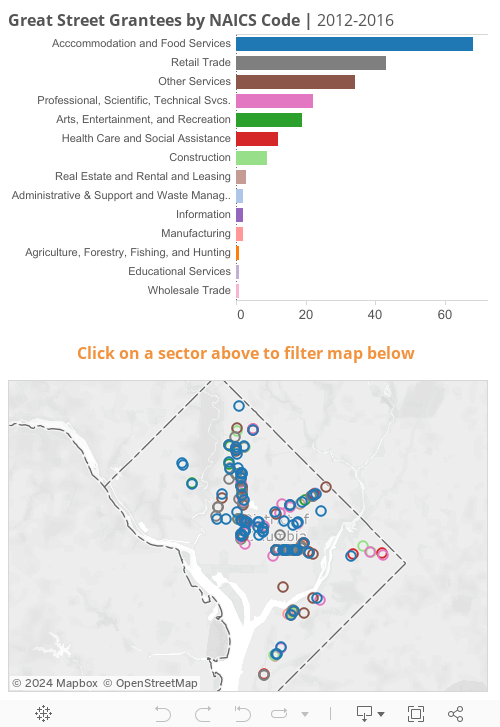
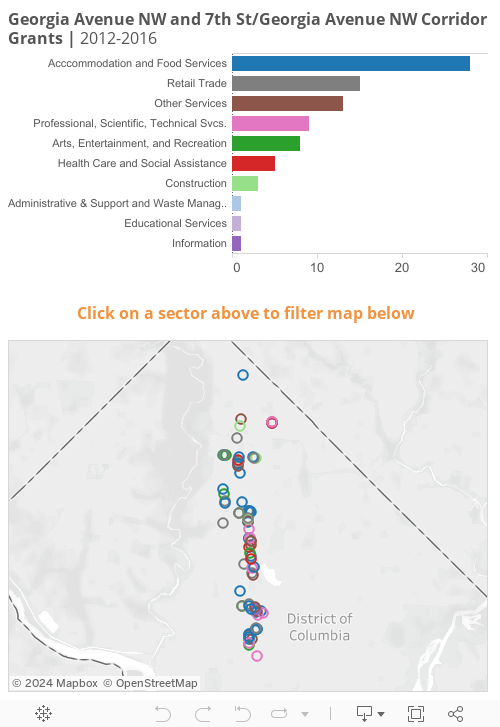
Visualizing the Great Streets Program
Since 2012, the Office of the Deputy Mayor for Planning & Economic Development (DMPED) has provided 219 competitive capital improvement grants to help small businesses renovate storefronts across D.C.’s 13 Great Streets corridors. Since DMPED began providing grants, it has supported a wide array of businesses ranging from retail and restaurants to interior design and tech firms. We grouped the grantees by what we thought would be their North American Industry Classification Codes (NAICs) based on their business description. The coding reveals that the majority of recipients are in “accommodation and food services”—a classification associated with restaurants, bars, and hotels. The other top industries supported are in “retail trade (e.g. clothing outlets, grocery stores), and “other services except public administration” (e.g. hair salons, auto repair). Below is a breakdown of how these investments have been distributed across D.C.’s Great Streets corridors by NAICS code from 2012 through 2016. Clicking on a NAICS sector allows you to filter the map view to see how different types of businesses have clustered. For example, health care grantees are distributed around the District, while professional services businesses are closer to the center of the city.