June 2016
June 29, 2016
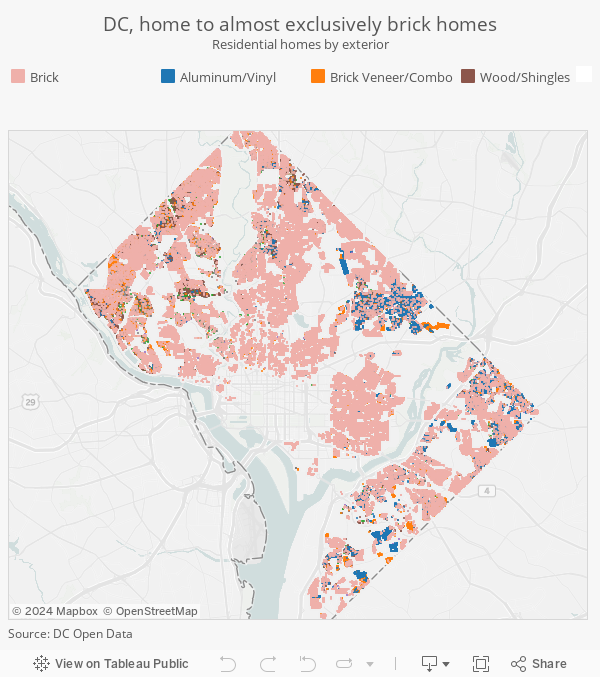
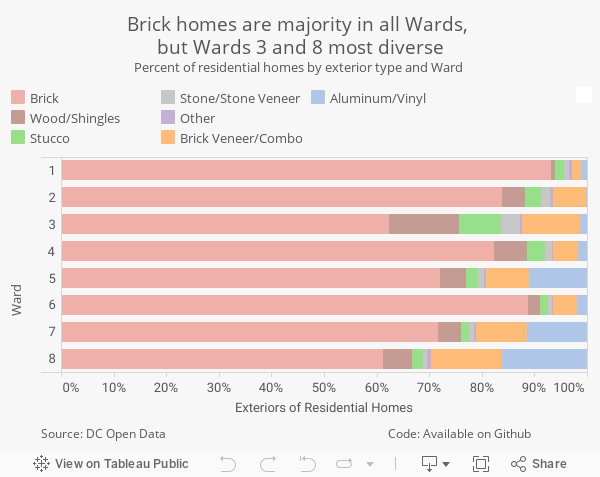
Guest post: Another Brick in the Ward
Kate Rabinowitz, creator of DataLensDCDC is a city with a diversity of people, businesses, and neighborhoods. But walking along the city’s residential streets you may notice one aspect of the city that isn’t particularly diverse at all - facades of DC homes. DC is home to almost exclusively brick homes. The map below shows each residential properties in the District by facade. More than three-quarters of home facades in DC are brick. While brick homes are prevalent across the District, they are most common in the District’s oldest neighborhoods. Brick would’ve been the most common building material at the time and, in some areas, historic preservation limits the building materials that can be used today. In Ward 1 over 90% of homes are brick. Houses become more diverse further from the core of the city, where homes are likely to be newer. Wards 3 and 8, located at opposite ends of the District, have the most diversity of home facades. Data are available through DC’s open data website. You can find complete code for on my github page.
June 24, 2016
Heat mapping the Great Streets small business grant program
In 2012, the inaugural Great Streets Corridor was developed in Ward 6 on H Street NE, benefiting 16 small businesses. Since then, corridors have expanded to 13 locations, funding over 200 businesses in all eight Wards. Although funding for the Great Streets initiative has not increased significantly in three years, more small businesses were awarded grant money in the 2016 fiscal year than FY14 and FY15 combined. In 2016, the cap on individual grants decreased from $85k to $50k which extended opportunities to a higher number of local businesses. Great Streets is the District’s commercial revitalization initiative to transform emerging corridors into thriving and inviting neighborhood centers. Funding is to support existing small businesses, attract new businesses, increase the District's tax base, and create new job opportunities for District residents.For more information, visit the Great Streets website here.
June 23, 2016
Unemployment by Ward
Since 2002, DC’s Department of Employment Services (DOES) Labor Market Research and Information division has been tracking the unemployment rate by Ward. This metric refers to the rate of unemployment within the labor force residing in each Ward. The District-wide unemployment rate helps us track the health of the District’s labor force overall, but it obscures the reality of geographic differences within DC’s labor force. In May, Ward 8 showed the lowest unemployment reading since the metric has been tracked. The previous record low for Ward 8 was in April 2008. Historically, Wards 5, 7, and 8 have experienced resident unemployment at rates above the District-wide average. Wards 1, 2, 3, and more recently, 6, have experienced below-average unemployment. Ward 4 has typically tracked closely with the District-wide rate. The chart below shows non-seasonally adjusted monthly unemployment readings. Seasonal employment patterns account for some of the month-to-month volatility. Other large month-to-month jumps seen below are attributable to one-time changes in estimation methodology and Ward boundary changes.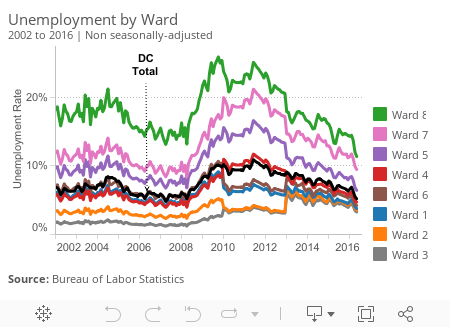
June 15, 2016
How Single-Family Housing Prices Have Changed in DC
When housing prices in the United States fell precipitously across 2008 and 2009, many DC zip codes weathered the crisis quite well—maintaining relatively consistent single-family housing prices throughout. Using a new repeat-sales home price index (HPI) from the Federal Housing Finance Administration, we can see some city neighborhoods were affected more than others. A few have not seen prices bounce back to pre-crisis levels, while others have seen prices surge far higher than before. As of 2015, numbers across many of DC’s zip codes have well surpassed a 2007 pre-crisis HPI peak. Zip codes shown in blue in the second chart below saw price decreases following the recession in 2008, but recovered in the years following. The three with the highest home-price index readings in 2015 were 20001, 20002, and 20010. These zip codes cover the neighborhoods of Bloomingdale, Eckington, Ivy City, Trinidad, NoMa, Capitol Hill, and parts of Columbia Heights, Mount Pleasant, Park View, and Shaw. On the other hand, homes across zip codes 20019, 20020, and 20032 also decreased in price following the recession but have remained lower-priced compared to the peak they reached in 2007. They are the only zip codes in DC that have not exceeded pre-crisis HPI levels. These three zip codes, all of which are located east of the Anacostia River, include the neighborhoods of Benning, Capitol View, Congress Heights, Deanwood, Grant Park, and Historic Anacostia. Zip codes 20019 and 20032 represent housing prices with the lowest average increase in DC since the year 2000, according to the HPI data. A few zip codes in DC showed very little price volatility in the periods before and after the mortgage meltdown. These low-volatility neighborhoods include Adams Morgan, Chevy Chase, Cleveland Park, Georgetown, Palisades, and Tenleytown.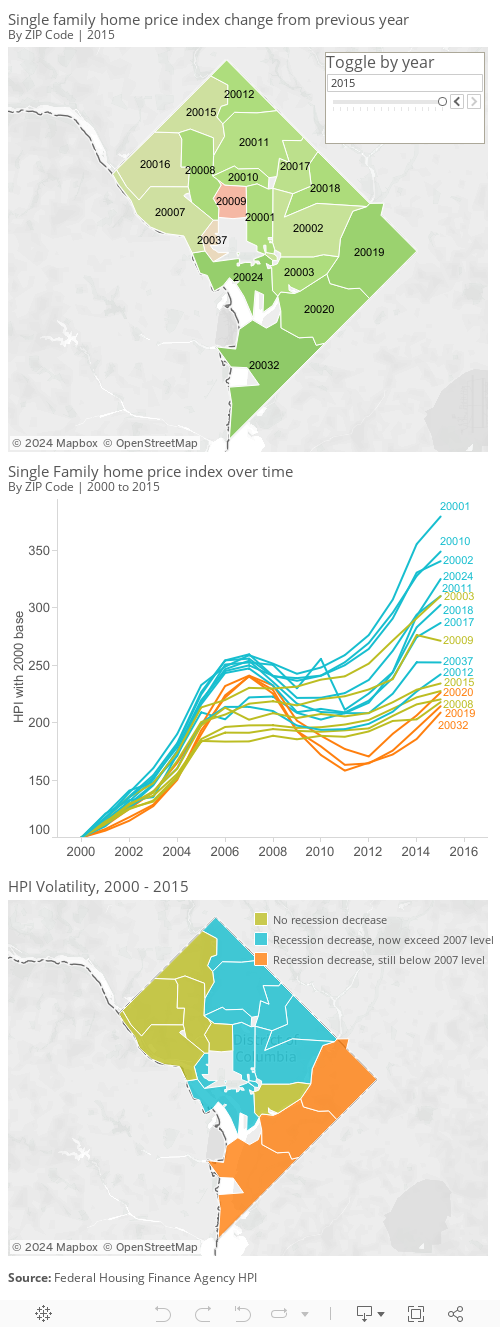
June 9, 2016
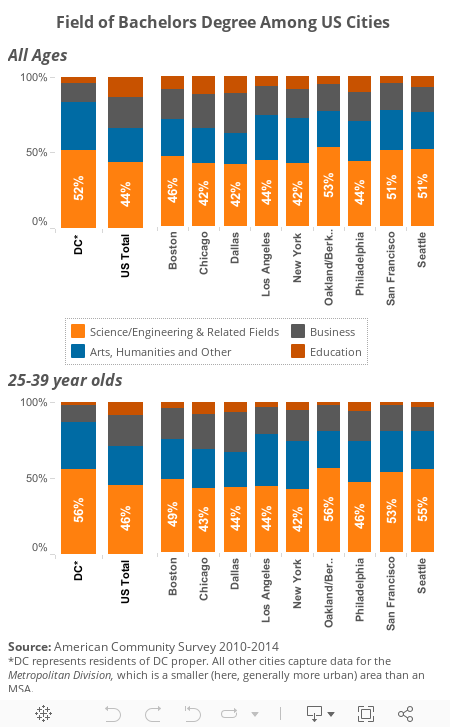
Thought DC residents were a bunch of humanities majors? Turns out DC is STEM-heavy (no, really!)
We often hear that the DC area is among the best-educated in the country, with a high concentration of college-educated residents and graduate degree-ho lders. According to a recent data-rich report from DC-based incubator and seed fund 1776 called Innovation that Matters*, among major US cities, the DC region also has the highest proportion of more recent graduates. It was the only region in the study where over 8% of the population were aged 25-34 and had a college degree. Yet DC is not at the top of all of the report’s measures; in terms of total startups the Bay Area, New York City, Boston, Los Angeles, and Seattle outpace DC (though New York and LA have larger populations). There has been some speculation that this may be because the college grads in DC have different degrees than college grads in other cities, for example fewer STEM graduates and more humanities majors. The answer when we look at the District of Columbia in American Community Survey data, is that such speculation does not match the data. The District actually has a higher proportion of bachelors degree-holders in science and engineering fields, but fewer in business, than the US as a whole – and many other large cities. And this is particularly true for the millenial cohort of the working population, residents aged 25-39. Among that age group, DC actually leads other major US cities for the proportion of 4-year degree-holders who graduated in scientific fields.