August 2016
August 25, 2016
Interactive DC salary data
Two weeks ago we used wage data from the Bureau of Labor Statistics’ Occupational Employment Statistics (OES) dataset to analyze the occupations that make up DC’s ‘creative class’. This week, District, Measured, the blog of DC’s Office of Revenue Analysis, posted a fantastic investigation of DC’s high, low, and middle-wage occupations, and where workers in those jobs tend to live. That analysis also used OES data as a basis for defining occupations by wage level. But what, specifically, are the salaries associated with specific occupations in DC? In our chart of the week, we provide an interactive tool to examine the reality of what workers in DC earn annually using the OES data. Below, you can see the distribution of DC salaries for both full-time and part-time workers, by occupation. Note that these occupations cross public and private sector lines – the phlebotomist category here includes both government phlebotomists and private sector phlebotomists.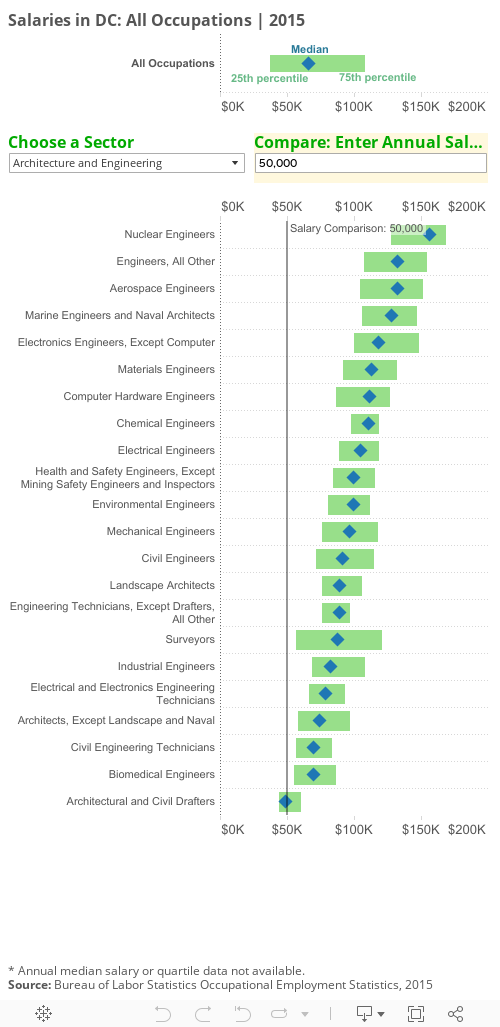
The lowest median salaries, for occupations which have annual salary data, include food prep workers and wait staff. Occupations in the food prep and serving sector have the lowest median wages, followed by personal care and service occupations. However, food prep and serving is the fourth largest occupation sector represented in DC. And the sector is growing – in 2015, 8.0% of jobs in DC were in food prep and serving, up from 6.3% in 2005. There’s been a net gain of over 15,800 jobs in the sector in that five year period, over 11,000 of which were added since 2010. Meanwhile, as District, Measured notes, the workers in these low-wage occupations are less likely to live in DC, where they work. Most likely, this means that workers from the surrounding area are more likely to come to DC for this influx of jobs, and workers in these occupations who used to live in DC are moving out because of affordability concerns.
BLS Occupational Employment Statistics (OES) data is available here.
August 17, 2016
Tracking the Flows of Businesses in the District
In the last few years, DC has seen sustained job growth and an increase in the rate of employment for District residents. Using the Bureau of Labor Statistics’ (BLS) Business Employment Dynamics Survey (BDM), we get a view into the lifecycle of businesses in DC. A related BLS data series, the Quarterly Census of Employment and Wages (QCEW), tracks almost 38,000 public and private business establishments in DC, as of 2015. While the QCEW data and other sources can be useful for measuring the stock, the BDM data measures the flow of businesses being created (or closing), moving into (or out of) DC, or the pace consolidation & acquisitions. The chart below shows this flow of business entrants and exits since 2010.
BLS Business Employment Dynamics Data (BDM Data) is available here.
August 10, 2016
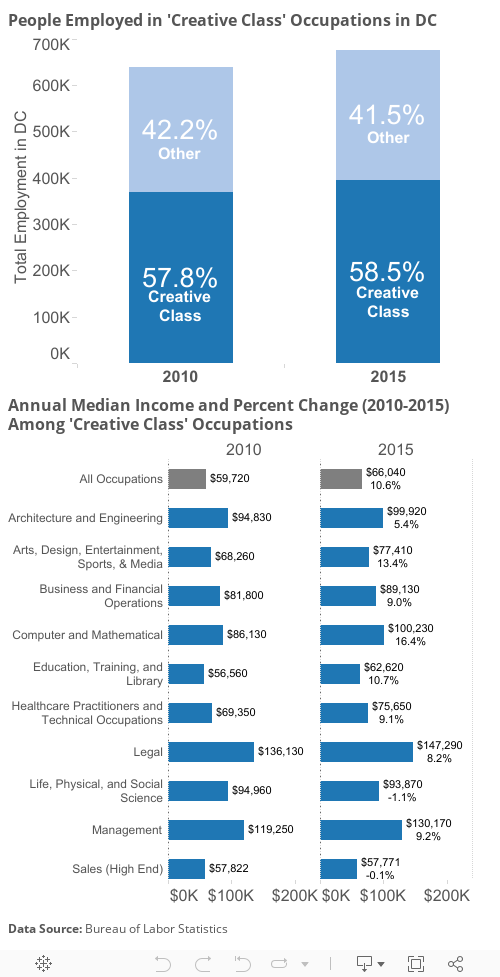
DC’s “Creative Class”: An Update
In Richard Florida’s The Rise of the Creative Class, first published in 2002, Florida promotes the idea that urban economic growth is closely linked to a city’s ability to support and grow the “Creative Class.” This group is defined by occupations that require certain levels of creativity -- realized through the traditional artistic endeavors or through complex professional problem solving. Essentially, Florida’s argument is that cities which provide desirable environments for creative professionals generally prosper while those that do not typically fall behind. His argument boils down to the fact that it isn’t access to raw materials or even large corporations that drive economic advantage. Rather, it is talented and creative people who spur growth and innovation at the local and regional level. In Washington, D.C., over 50% of jobs are in Creative Class fields. Florida breaks down the Creative Class into ten occupational groups derived from the U.S. Bureau of Labor Statistics’ (BLS) Occupational Employment Statistics (OES). 2010 OES data indicated that 57.8% of Washington D.C.’s workforce was made up of Creative Class workers. According to 2010 data, the Washington metro area had the third largest share of Creative Class individuals (46.8%), right behind the metro areas of San Jose, CA and Durham, NC, with shares of 46.9% and 48.4% respectively. The fact that the District's share of the metro area's Creative Class has remained constant since then reflects well on its ability to retain Creative Class workers. We’ve updated the DC metrics using the same methodology and 2015 OES survey data (the most recent). Even as the number of jobs in DC has grown, and we’ve shifted to a less Federal government centric labor market, the share of Creative Class workers stayed relatively constant at 58.5%. It’s interesting to note that these occupation groups, shown in the second chart below, can also overlap with government employment – that is, some people in computer and mathematical occupations may be Federal employees.