July 2016
July 28, 2016
A new index for housing market activity
There are a number of ways to track the health of the housing market in the US. Particularly after the housing crisis, watching for signs of housing market overheating is of keen interest for economic policymakers. We track several measures of home prices and buying/selling behavior, some of which can be seen on our Economic Intelligence Dashboard here. Many indices use public real estate transaction records or mortgage data as their source of home prices. In the most recent edition of the US Department of Housing and Urban Development’s Cityscape journal, mathematician Nikos Askitas proposes a new housing index based on Google Trends results. The BUSE index (buyers sellers index), as described in the article here, measures the ratio of home purchase interest vs. home selling interest in the US housing market based on Google search data. The BUSE index for the US housing market correlates significantly with the Standard & Poor’s/Case-Shiller® Home Price Index, but has the key advantage of sourcing almost real-time data. The result is a “nowcast” of US home buying and selling behavior, and a leading indicator of US home prices. Following the methodology of Askitas*, we re-created the BUSE index just for DC. In the period between 2005 – 2016, the DC BUSE index consistently shows more search interest in buying vs. selling. The same is true for the US index (see the graphic from Askitas’ paper below). However, DC’s BUSE index reaches a higher peak and a higher low than the US index. In late 2012, for example, home-buying searches outnumbered home-selling searches in DC by 3.5 to 1.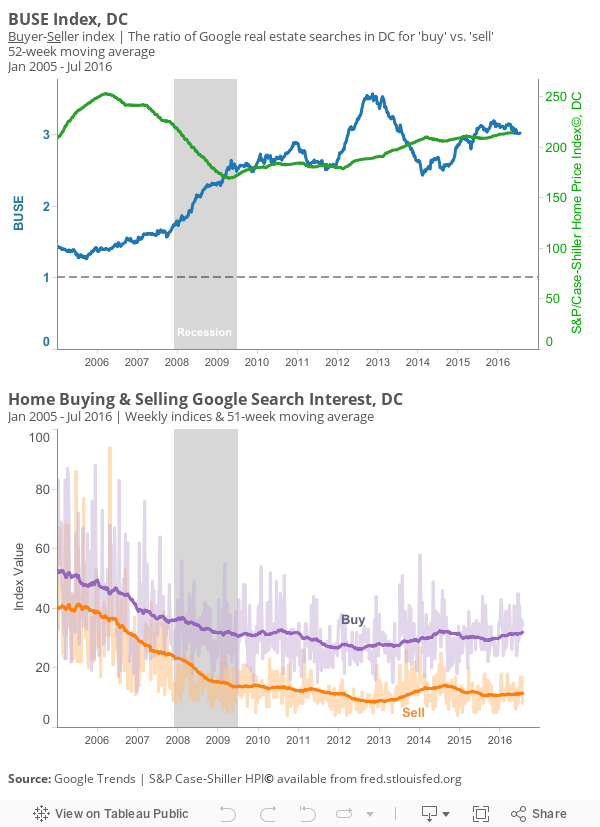

Figure from Askitas, "Trend-Spotting in the Housing Market," Cityscapes, 2016
This result certainly squares with DC being one of the more expensive housing markets in the country. Plus, buyer interest outweighing inventory means that homes tend to sell more quickly than in other areas. However, the DC index is not as correlated to home prices as the US index is. This is most likely because Google data measures what people are searching for in DC, but doesn’t capture searches by people outside DC who will eventually buy in DC. Though DC’s search data skews toward buyers, this index is probably an underestimate of the buying interest in DC. *With a slight tweak – we smooth the Google data using simply a 52-week moving average.July 15, 2016
The difference two years makes to income distribution in DC
We analyzed 2011 and 2013 (the most recent year available) adjusted gross income data from the IRS. Even over this short time period, there were notable changes in the household income distribution in DC. While this dataset cannot say whether the changes were caused by households moving into, out of, or within DC, or whether income distribution shifts occurred because of rising incomes, it does highlight some interesting trends. Certain zip codes saw large changes even over this short period. For example, zip code 20001, which had a total of 23,890 filers in 2013 (an increase of 8.8% overall), saw a 45.1% increase in total tax filers making $200,000 or more (from 882 to 1,280), a 18.1% increase in those making between $100,000-$200,000 (from 3,023 to 3,570), and a 23.8% increase in those making between $75,000-100,000 (from 2,060 to 2,550). Still, its largest class of filer were in the $1-$25,000 range (6,735 in 2011 and 6,560 in 2013). Zip code 20001 is in the middle of the city and includes parts of the Bloomingdale, Chinatown, East End, Mount Vernon Triangle, and Shaw neighborhoods.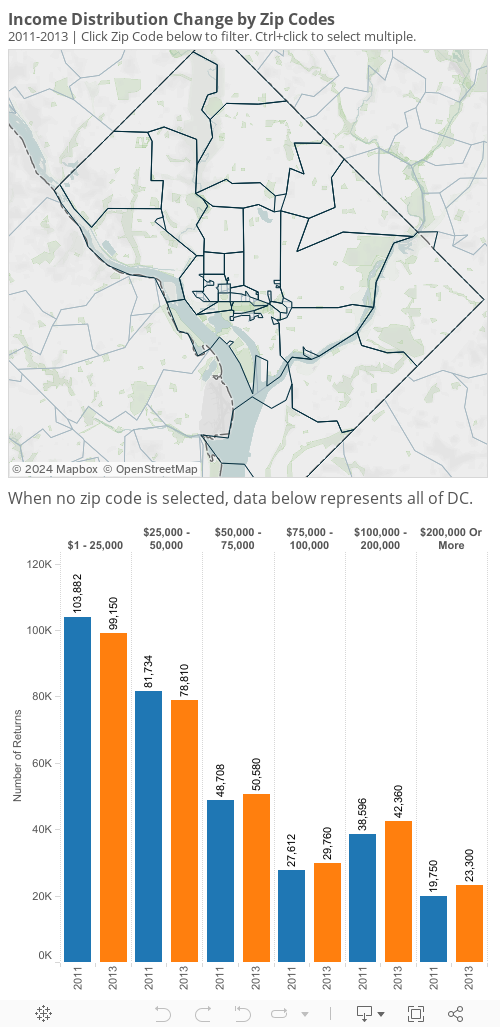
July 6, 2016
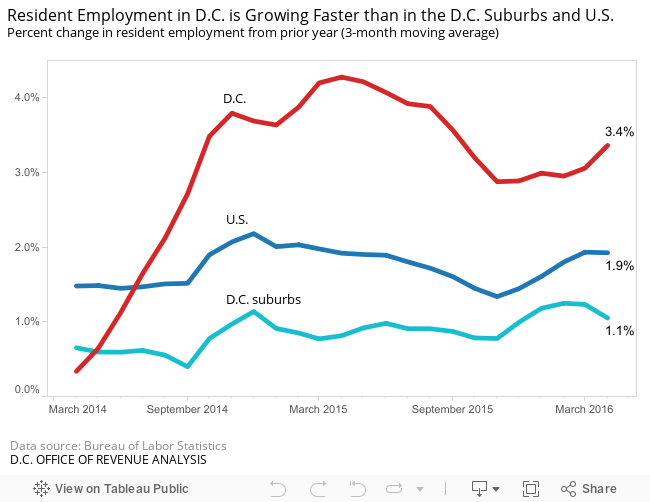
Guest post: Resident Employment in D.C. is Growing Faster than in the D.C. Suburbs and U.S.
Stephen SwaimDC Office of Revenue Analysis, Office of the Chief Financial Officer | Contributor to District, Measured Since the summer of 2014, the number of residents who are employed has been growing at a rate that’s about two to four times higher in D.C. than in the city’s suburbs. About 20 percent of the increase in D.C.’s resident employment appears to be from more unemployed people working, but this doesn’t account for most of D.C.’s faster growth rate compared to the suburbs. The faster growth rate is primarily due to population growth. New residents either moved to the city for a job in the region or were already employed in the region and moved into D.C. proper.