
Chart of the Week
November 16, 2016
District Buyer’s Club: Mortgages and Home Buying in DC
This week we’re taking a look at a mortgage data to find out more about households buying homes in DC. Here, we’re looking at mortgages taken out for the purpose of buying a home between 2007-2015, excluding refinances and home-improvement loans. Not all home buyers take out a mortgage to buy their home. In fact, cash-buyer activity in DC made up a growing portion of the market post-recession (but has since retreated) as investors saw opportunity in the wake of the housing price crash and foreclosure crisis. And to look at the behavior of non-investors, we’ve also limited the data to households which purchased intending to occupy the home themselves.
Overall, the volume of home purchase lending in DC has been on a slight upward trajectory since compressing amid the recession. In fact, DC saw in 2015 the most home-purchase loans made since 2007. Homes for sale in DC are expensive, and the average income of households who are taking out mortgages for home purchase is rising at a faster rate than the overall household income in DC. The first chart below shows the distribution of household incomes listed on mortgage applications for homebuyers who got mortgages. The gray dots show the HUD median household income for DC.
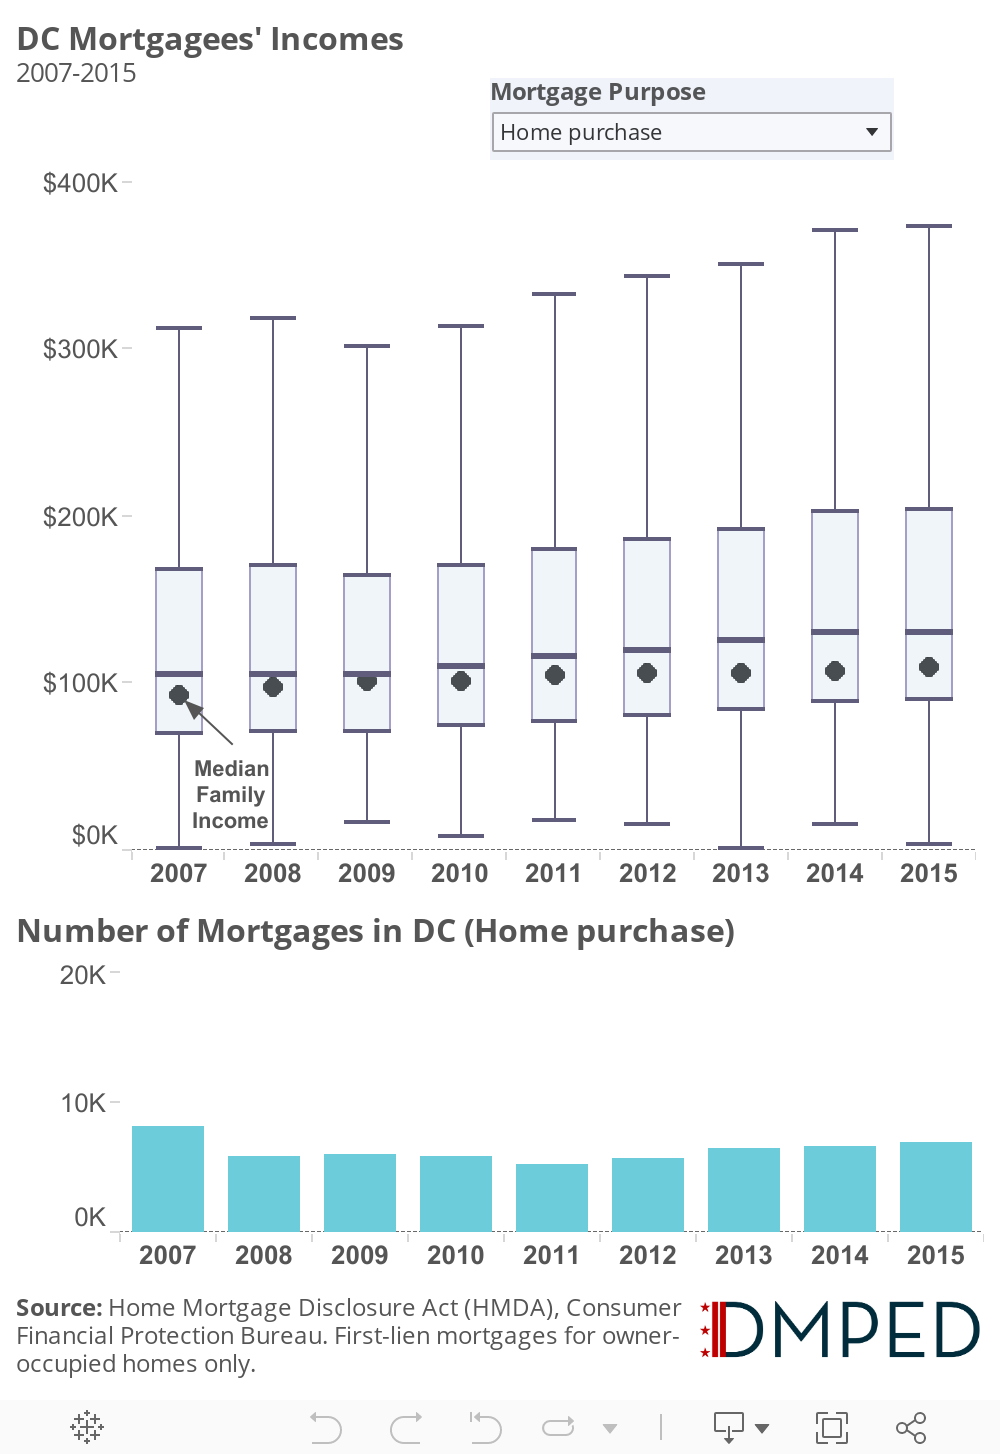
Though homebuyer incomes are rising on average, we still see significant numbers of households below median income are able to buy homes in DC. Scroll through the second visualization below to see the evolution of home-purchase borrower incomes since 2007. The largest group getting mortgages for home purchase in DC were those with a primary borrower making between $75-$100K in annual income. The upper tail has been growing; households making over $250K have been taking out mortgages for home purchase at higher volumes in recent years. But at the same time, over 1000 households in DC with income less than $75K took out a home-purchase loan last year. And unlike in the lending environment in 2007, we can be more sure that those households were not victims of predatory lending practices.
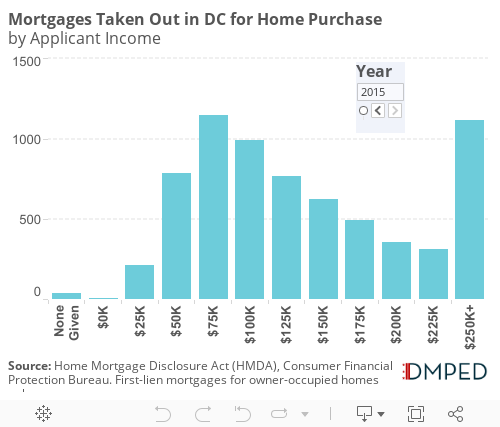
Loan volume for households with less than $75K income may have been higher in 2007 due to subprime lending. And lower-income lending has decreased – in 2015, home purchase lending to households making less than $50,000 is at less than a third of what it was in 2007. The prevalence of low-doc and no-doc loans (so-called ‘liar’ loans) and subprime & predatory lending precipitated the housing crash. Here in DC, though the District proved more resilient to some of the effects of the recession, we can see that the housing market was not immune to some of those bad practices. In 2007, there were over four times as many mortgages where no income was reported on the application than in 2008. Those loans have all but disappeared, though it is possible to acquire a mortgage based on assets and not income.
What is this data?
The Home Mortgage Disclosure Act requires lenders to push out information on all mortgage applications so that citizens and policymakers can better understand their local housing markets. Read more and download data here.